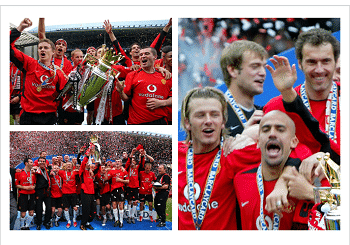
Welcome to the Premier League 2012-13 season! This was a season that had it all – breathtaking goals, nail-biting finishes, and drama that kept us on the edge of our seats. Remember when Sir Alex Ferguson, the legendary manager of Manchester United, bid adieu to the football world with a bang by clinching the Premier League title? Or when the underdogs Swansea City stunned everyone by lifting the League Cup? This was also the season when the ‘noisy neighbors’ Manchester City had to settle for the second spot, and Chelsea, despite their roller-coaster ride, managed to secure a respectable third place. And let’s not forget the heartbreak of Wigan Athletic, Reading, and Queens Park Rangers, who faced the dreaded drop to the Championship. From the highs of victory to the lows of defeat, the 2012-13 Premier League season was a roller-coaster ride of emotions. So, strap in and get ready to relive the magic, the mayhem, and the sheer magnificence of one of the most memorable seasons in Premier League history!
Pos
Club
Pld
Home
Away
Goals
Goals
GD
Pts
W
D
L
GF
GA
W
D
L
GF
GA
GF
GA
1
Manchester United
38
16
0
3
45
19
12
5
2
41
24
86
43
43
89
2
Manchester City
38
14
3
2
41
15
9
6
4
25
19
66
34
32
78
3
Chelsea
38
12
5
2
41
16
10
4
5
34
23
75
39
36
75
4
Arsenal
38
11
5
3
47
23
10
5
4
25
14
72
37
35
73
5
Tottenham Hotspur
38
11
5
3
29
18
10
4
5
37
28
66
46
20
72
6
Everton
38
12
6
1
33
17
4
9
6
22
23
55
40
15
63
7
Liverpool
38
9
6
4
33
16
7
7
5
38
27
71
43
28
61
8
West Bromwich Albion
38
9
4
6
32
25
5
3
11
21
32
53
57
-4
49
9
Swansea City
38
6
8
5
28
26
5
5
9
19
25
47
51
-4
46
10
West Ham United
38
9
6
4
34
22
3
4
12
11
31
45
53
-8
46
11
Norwich City
38
8
7
4
25
20
2
7
10
16
38
41
58
-17
44
12
Fulham
38
7
3
9
28
30
4
7
8
22
30
50
60
-10
43
13
Stoke City
38
7
7
5
21
22
2
8
9
13
23
34
45
-11
42
14
Southampton
38
6
7
6
26
24
3
7
9
23
36
49
60
-11
41
15
Aston Villa
38
5
5
9
23
28
5
6
8
24
41
47
69
-22
41
16
Newcastle United
38
9
1
9
24
31
2
7
10
21
37
45
68
-23
41
17
Sunderland
38
5
8
6
20
19
4
4
11
21
35
41
54
-13
39
18
Wigan Athletic
38
4
6
9
26
39
5
3
11
21
34
47
73
-26
36
19
Reading
38
4
8
7
23
33
2
2
15
20
40
43
73
-30
28
20
Queens Park Rangers
38
2
8
9
13
28
2
5
12
17
32
30
60
-30
25
Premier League 2012-13: A Season to Remember
The 2012-13 Premier League season was one for the history books, filled with thrilling matches, unexpected results, and unforgettable moments. This page is dedicated to providing you with a comprehensive overview of the season, from the final league table to individual match results, goal distribution, and more.
Home Team/ Away Team
Arsenal
2-1
1-2
0-0
3-3
2-2
0-2
1-1
7-3
3-1
1-0
4-1
6-1
1-0
0-0
0-2
5-2
2-0
5-1
4-1
Aston Villa
0-0
1-2
1-3
1-1
1-2
0-1
2-3
1-2
1-1
3-2
1-0
0-1
0-0
6-1
2-0
0-4
1-1
2-1
0-3
Chelsea
2-1
8-0
2-1
0-0
1-1
0-0
2-3
2-0
4-1
0-1
4-2
2-2
1-0
2-1
2-0
2-2
1-0
2-0
4-1
Everton
1-1
3-3
1-2
1-0
2-2
2-0
1-0
2-2
1-1
2-0
3-1
3-1
1-0
2-1
0-0
2-1
2-1
2-0
2-1
Fulham
0-1
1-0
0-3
2-2
1-3
1-2
0-1
2-1
5-0
3-2
2-4
1-1
1-0
1-3
1-2
0-3
3-0
3-1
1-1
Liverpool
0-2
1-3
2-2
0-0
4-0
2-2
1-2
1-1
5-0
1-0
1-0
1-0
0-0
3-0
5-0
3-2
0-2
0-0
3-0
Manchester City
1-1
5-0
2-0
1-1
2-0
2-2
2-3
4-0
2-3
3-1
1-0
3-2
3-0
3-0
1-0
2-1
1-0
2-1
1-0
Manchester United
2-1
3-0
0-1
2-0
3-2
2-1
1-2
4-3
4-0
3-1
1-0
2-1
4-2
3-1
2-1
2-3
2-0
1-0
4-0
Newcastle United
0-1
1-1
3-2
1-2
1-0
0-6
1-3
0-3
1-0
1-0
1-2
4-2
2-1
0-3
1-2
2-1
2-1
0-1
3-0
Norwich City
1-0
1-2
0-1
2-1
0-0
2-5
3-4
1-0
0-0
1-1
2-1
0-0
1-0
2-1
2-2
1-1
4-0
0-0
2-1
Queens Park Rangers
0-1
1-1
0-0
1-1
2-1
0-3
0-0
0-2
1-2
0-0
1-1
1-3
0-2
3-1
0-5
0-0
1-2
1-2
1-1
Reading
2-5
1-2
2-2
2-1
3-3
0-0
0-2
3-4
2-2
0-0
0-0
0-2
1-1
2-1
0-0
1-3
3-2
1-0
0-3
Southampton
1-1
4-1
2-1
0-0
2-2
3-1
3-1
2-3
2-0
1-1
1-2
1-0
1-1
0-1
1-1
1-2
0-3
1-1
0-2
Stoke City
0-0
1-3
0-4
1-1
1-0
3-1
1-1
0-2
2-1
1-0
1-0
2-1
3-3
0-0
2-0
1-2
0-0
0-1
0-0
Sunderland
0-1
0-1
1-3
1-0
2-2
1-1
1-0
0-1
1-1
1-1
0-0
3-0
1-1
1-1
2-2
1-2
2-4
3-0
1-0
Swansea City
0-2
2-2
1-1
0-3
0-3
0-0
0-0
1-1
1-0
3-4
4-1
2-2
0-0
3-1
2-2
1-2
3-1
3-0
2-1
Tottenham Hotspur
2-1
2-0
2-4
2-2
0-1
2-1
3-1
1-1
2-1
1-1
2-1
3-1
1-0
0-0
1-0
1-0
1-1
3-1
0-1
West Bromwich Albion
1-2
2-2
2-1
2-0
1-2
3-0
1-2
5-5
1-1
2-1
3-2
1-0
2-0
0-1
2-1
2-1
0-1
0-0
2-3
West Ham United
1-3
1-0
3-1
1-2
3-0
2-3
0-0
2-2
0-0
2-1
1-1
4-2
4-1
1-1
1-1
1-0
2-3
3-1
2-0
Wigan Athletic
0-1
2-2
0-2
2-2
1-2
0-4
0-2
0-4
2-1
1-0
2-2
3-2
2-2
2-2
2-3
2-3
2-2
1-2
2-1
ARS
AST
CHE
EVE
FUL
LIV
MNC
MNU
NUC
NOR
QPR
RFC
SFC
SCF
SUN
SWA
TOT
WBA
WHU
WIG
Total Games Played:
Home Wins: 166
Draws: 108
Away Wins: 106
Total Goals: 1,066
Statistics correct to
380
43.68%
28.42%
27.89%
Goals/game 2.80
19th May 2013
Goals
x
Total
1st Half Goals
2nd Half Goals
Home Goals
Away Goals
0
35
0
466
597
592
471
1
61
61
2
72
144
3
91
273
4
64
256
5
32
160
6
13
78
7
9
63
8
1
8
9
0
0
10
2
20
Total
380
1,063
end
Club
Position
Attempts off target
Attempts on target
Shots on goal
Goals
Ratio
Manchester United
1
181 (43,3%)
237 (56,7%)
418
86
20,6%
Chelsea
3
200 (50,0%)
200 (50,0%)
400
75
18,8%
Arsenal
4
191 (47,6%)
210 (52,4%)
401
72
18,0%
Reading
19
140 (56,0%)
110 (44,0%)
250
43
17,2%
Aston Villa
15
136 (48,4%)
145 (51,6%)
281
47
16,7%
West Bromwich Albion
8
166 (51,4%)
157 (48,6%)
323
53
16,4%
Fulham
12
145 (46,6%)
166 (53,4%)
311
50
16,1%
Sunderland
17
128 (48,3%)
137 (51,7%)
265
41
15,5%
Norwich City
11
150 (55,1%)
122 (44,9%)
272
41
15,1%
Liverpool
7
238 (50,2%)
236 (49,8%)
474
71
15,0%
Manchester City
2
221 (48,8%)
232 (51,2%)
453
66
14,6%
Wigan Athletic
18
165 (51,1%)
158 (48,9%)
323
47
14,6%
West Ham United
10
164 (52,4%)
149 (47,6%)
313
45
14,4%
Southampton
14
173 (50,4%)
170 (49,6%)
343
49
14,3%
Everton
6
187 (47,8%)
204 (52,2%)
391
55
14,1%
Tottenham Hotspur
5
223 (47,4%)
247 (52,6%)
470
66
14,0%
Swansea City
9
178 (51,6%)
167 (48,4%)
345
47
13,6%
Stoke City
13
143 (54,2%)
121 (45,8%)
264
34
12,9%
Newcastle United
16
181 (50,4%)
178 (49,6%)
359
45
12,5%
Queens Park Rangers
20
179 (56,1%)
140 (43,9%)
319
30
9,4%
Match Results and League Table
Every match played during the 2012-13 season contributed to the final standings of the Premier League table. From the nail-biting draws to the landslide victories, each game played a crucial role in shaping the season. The final league table is a testament to the hard-fought battles on the pitch, showcasing the triumphs and tribulations of each team throughout the season.
Goal Distribution and Scoring Opportunities
Goals are the lifeblood of football, and the 2012-13 Premier League season was no exception. The goal distribution statistics provide a fascinating insight into the scoring patterns of the season, including goals scored by half and by venue. Additionally, the goal scoring opportunity and conversion ratios offer a deeper understanding of each team’s offensive prowess and efficiency in front of the goal.
Statistics Correct to Matchday 38
All statistics presented here are correct up to the final matchday of the season, 11th May 2013. This ensures that you’re getting the most accurate and complete picture of the 2012-13 Premier League season.
Explore Other Premier League Seasons
If you’re interested in comparing the 2012-13 season with other Premier League seasons, we’ve got you covered. You can delve into the tables and results from the 2019-20 season all the way back to the 2008-09 season. Each season has its own unique story to tell, filled with its own heroes, villains, triumphs, and heartbreaks.
Whether you’re a football historian, a trivia enthusiast, or a fan looking to relive some of the Premier League’s most exciting moments, we hope you find this page informative and engaging. Happy exploring!
Lorem Ipsum is simply dummy text of the printing and typesetting industry. Lorem Ipsum has been the industry's standard dummy text ever since the 1500s, when an unknown printer took a galley of type and scrambled it to make a type specimen book. It has survived not only five centuries, but also the leap into electronic typesetting, remaining essentially unchanged. It was popularised in the 1960s with the release of Letraset sheets containing Lorem Ipsum passages, and more recently with desktop publishing software like Aldus PageMaker including versions of Lorem Ipsum.